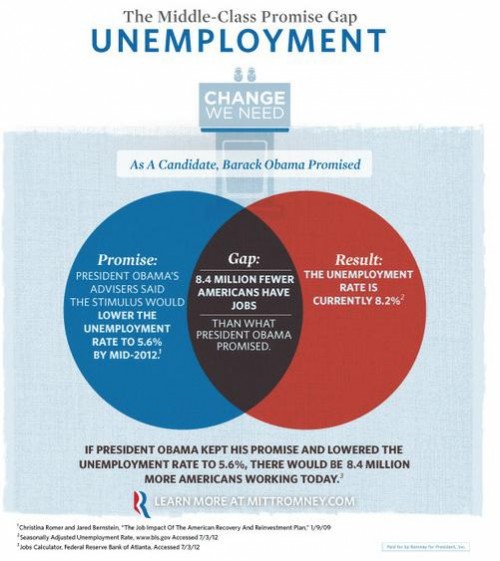
The Romney campaign draws some Venn Diagrams, proving that they don’t understand how Venn Diagrams work:
This is how a Venn Diagram works:
Besides, everyone knows why unemployment is still high — Republicans have sabotaged the economy over and over again. They filibustered the American Jobs Act, stonewalled the stimulus, threatened a US default (and in order to keep them from forcing a default, they demanded dramatic cuts in spending, costing 323,000 jobs), and they again threatened a government shutdown in 2011. Indeed, the things they have insisted on cutting are those things that would most help the economy recover, and most of the lost jobs they are complaining about are because of spending cuts in the government.
UPDATE: Perhaps we have it all wrong — the Romney campaign didn’t mean for these to be Venn Diagrams, they are an homage to the MasterCard logo:


3 Trackbacks/Pingbacks
[…] more here: Venn Diagrams archives, energy, environment, humor, media, politics, racism, supreme court, torture, […]
[…] to Political Wire and Political Irony. Share this:EmailRedditTumblrTwitterFacebookMoreDiggStumbleUponLike this:LikeBe the first to like […]
[…] Venn Diagrams This entry was posted in Uncategorized and tagged UI, Usability, UX. Bookmark the permalink. […]